
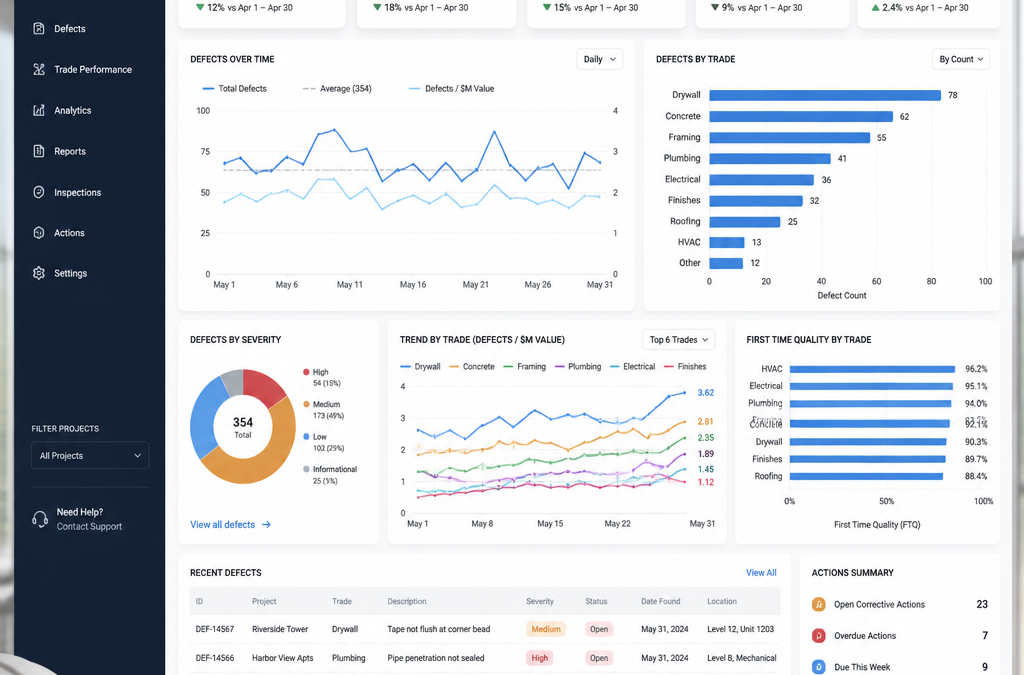
If you are a builder or developer finishing townhouses, highrise apartments, or house-and-land packages across Brisbane, the Gold Coast, or Logan, a defect call-back is not just an inconvenience. It is a direct cost that lands on your books while your subcontractors have already moved to the next site. A building defect statistics report in Brisbane changes that dynamic completely. Instead of chasing individual trades after the fact, you get aggregate data showing exactly which subcontractor is generating the most defect items across your projects, which construction phase is consistently underperforming, and where your quality assurance process has a gap. Builders and developers who use this data are not just fixing defects faster. They are stopping them from recurring.
Table of Contents
- What Is a Building Defect Statistics Report?
- Why Brisbane Builders and Developers Are Using Them Now
- The QBCC Defect Data Context Every Builder Needs to Know
- How Trade Performance Reporting Works in Practice
- Townhouse and Highrise Applications Across Brisbane and Gold Coast
- Comparing Reporting Approaches: What Actually Moves the Needle
- Quality Assurance Certificate and Practical Completion: How the Data Feeds Compliance
- Frequently Asked Questions
- References
What Is a Building Defect Statistics Report?
A building defect statistics report is not the same as a standard pre-handover inspection report. A standard inspection report documents what is wrong at a single property at a single point in time. A defect statistics report aggregates that data across multiple inspections, multiple lots, or multiple stages of a development to produce a ranked breakdown of defect frequency by trade, by construction phase, and by defect category.
For a builder completing a 40-lot townhouse development in Logan or a 12-storey highrise on the Gold Coast, that means you receive a clear picture of whether your painting subcontractor is producing defects at a rate that exceeds your other projects, whether your waterproofing trade is the source of repeat call-backs, or whether a specific construction stage, such as the practical completion walkthrough, is where defects are slipping through unchecked.
The report format that supports this kind of analysis requires photo-enhanced defect items, trade attribution on every item, and consistent category coding across inspections. Without those three elements, the data cannot be compared across properties and the statistics cannot be compiled. This is why the quality of the underlying inspection process matters as much as the summary report itself.
Pro tip: When commissioning inspections for a multi-lot development, confirm upfront that the inspector uses a consistent defect coding system across every lot. Inconsistent category labels make statistical comparison impossible and defeat the purpose of aggregating the data.
Why Brisbane Builders and Developers Are Using Them Now
The Brisbane and South East Queensland construction market has been under pressure from high volume, labour shortages, and subcontractor mobility. When subcontractors are moving between multiple sites and the same painting crew is finishing three different developments simultaneously, quality variability is inevitable. The question is whether you catch it early at the trade level or discover it lot by lot after the homeowner has already taken possession.
Builders and developers using defect statistics reports are doing something specific. They are using the aggregated data as a performance management tool in subcontractor review meetings. A painting subcontractor who generates 22 defect items across 8 lots in a development is presented with those numbers at contract renewal time, not with anecdotal complaints from site supervisors. That is a fundamentally different conversation, and it produces different behaviour.
There is also a risk management dimension. A developer who can demonstrate that independent inspections were conducted at every lot, that defect data was tracked by trade, and that rectification was completed before settlement is in a much stronger position if a dispute is later lodged with the Queensland Building and Construction Commission (QBCC). The documentation record is evidence of a systematic quality process, not just a reactive response to complaints.
Defective building work is more than a technical issue. It is a systemic challenge that affects builders, home owners, regulators, and the broader industry. The defects that appear most frequently are not only common but also, promisingly, preventable.
Developers managing staged releases of house-and-land packages in growth corridors such as Ipswich and Redland Bay are particularly well-positioned to benefit. When the same subcontractor team is used across multiple stages, a defect statistics report from Stage 1 gives you actionable quality intelligence before Stage 2 construction even begins. That is a genuine competitive advantage for a developer who wants to protect their brand across a long project timeline.

The QBCC Defect Data Context Every Builder Needs to Know
The Queensland Building and Construction Commission publishes an Industry Snapshot that identifies the most commonly reported building defects across the state. The March 2025 snapshot is directly relevant to any builder or developer operating in Brisbane and South East Queensland because it shows you the defect categories where your subcontractors are most likely to generate complaints.
Internal paint application is the number one reported defect type in Queensland, with 1,875 defect items identified across 315 complaint cases as at March 2025. That single statistic should reshape how any builder approaches their painting subcontractor quality process. Roof sheet metal cladding, flashings and capping, joinery installation, floor tiling, and plasterboard linings also rank consistently in the top 10 reported defects.
Waterproofing deserves separate attention. The QBCC reports that each residential bathroom claim finalised under the Queensland Home Warranty Scheme during the 2024 to 2025 financial year averaged almost $25,000 in rectification costs. Failed waterproofing causes structural damage, creates mould risk, and generates protracted disputes. For a developer finishing a highrise with multiple wet areas on every floor, a single waterproofing subcontractor generating consistent defects across multiple levels is an existential financial risk, not a minor quality issue.
What the QBCC data does not give you is a breakdown specific to your projects, your subcontractors, and your construction methodology. That is what a project-level defect statistics report provides. The industry data tells you where the risk categories are. Your own inspection data tells you which of your trades is underperforming relative to those benchmarks.
Pro tip: Use the QBCC Industry Snapshot categories as your defect coding benchmark. If your own inspection reports use the same category labels as the QBCC data, your internal statistics can be directly compared to the state-wide picture. That gives you an objective benchmark for subcontractor performance conversations.
How Trade Performance Reporting Works in Practice
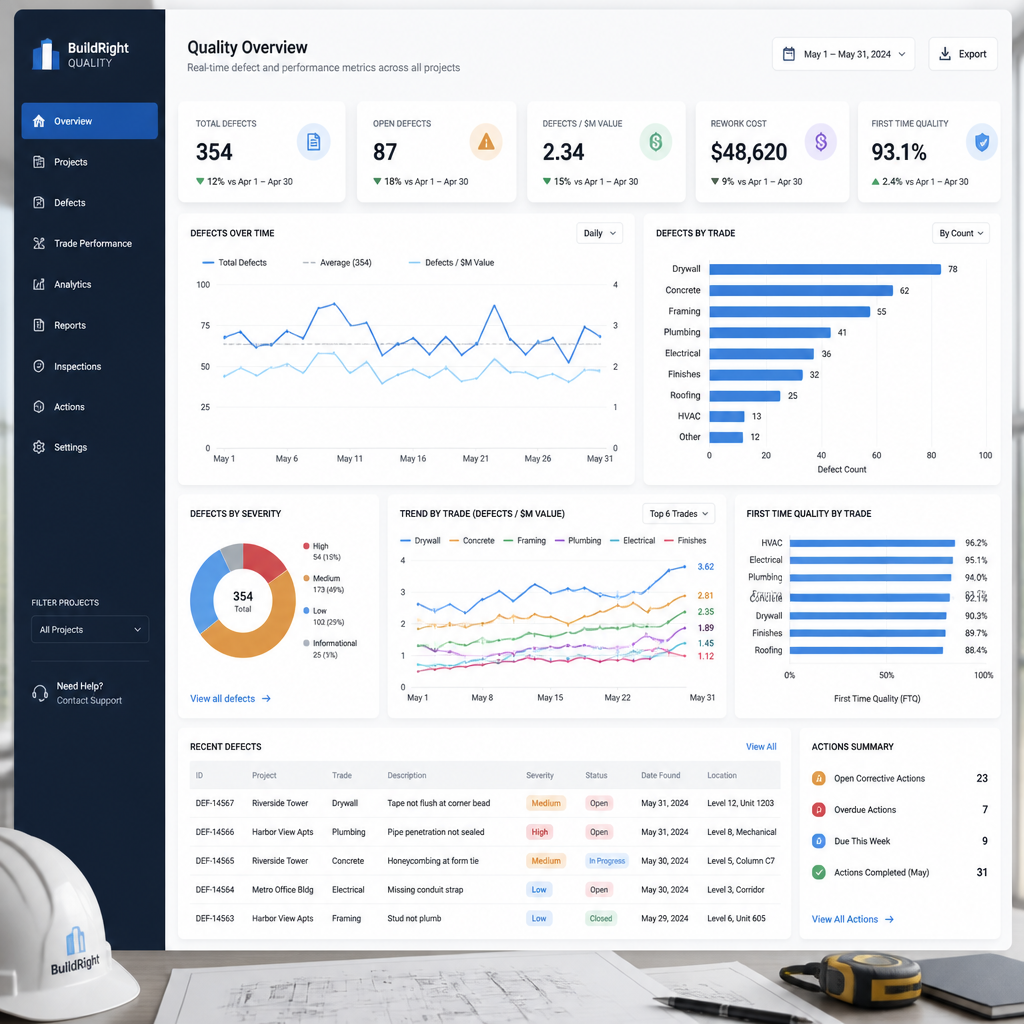
Trade performance reporting is the practical application of defect statistics. It takes the aggregated defect data from multiple inspections and produces a ranked view of each trade’s defect contribution, expressed as a frequency count and, where useful, as a defect rate per lot.
Setting Up the Data Structure
The data structure starts at the inspection level. Every defect item in every inspection report must have four attributes: a category label, a photo, a location reference within the property, and a trade attribution. Without the trade attribution, you cannot separate painting defects from carpentry defects when you aggregate across 20 lots. This is not a complex technical requirement, but it does require the inspection service to produce reports in a format that supports it.
GoInspect’s reports, for example, assign each defect item to the responsible trade as a standard part of the report format. This makes the aggregation step straightforward rather than requiring manual re-coding after the fact. For a builder managing a high-volume development, that difference in report format can save hours of administrative work per stage.
Conducting the Subcontractor Review
The subcontractor review meeting is where the performance data is used. A typical agenda item involves presenting the defect frequency table by trade, comparing it to the previous stage or a project baseline, and discussing specific recurring defect categories. The goal is not to punish the subcontractor for past defects. The goal is to identify the process or workmanship issue that is generating the defect and to agree on a corrective action before the next stage begins.
In practice, the most productive conversations happen when the data is presented in the context of photos. A painting subcontractor can dispute a verbal claim about paint application quality. They cannot easily dispute a table showing 22 defect items with photos attached, broken down by defect type, from 8 consecutive lots. The specificity of the data changes the tone of the conversation from adversarial to problem-solving.
Tracking Improvement Over Time
The real value of defect statistics reporting emerges across multiple stages of a development. A trade that generates 22 defects in Stage 1 and 14 in Stage 2 is improving. A trade that generates 22 in Stage 1 and 31 in Stage 2 needs a harder conversation, or a replacement decision. Neither of those conclusions is possible without the longitudinal data that statistics reporting provides.
Townhouse and Highrise Applications Across Brisbane and Gold Coast
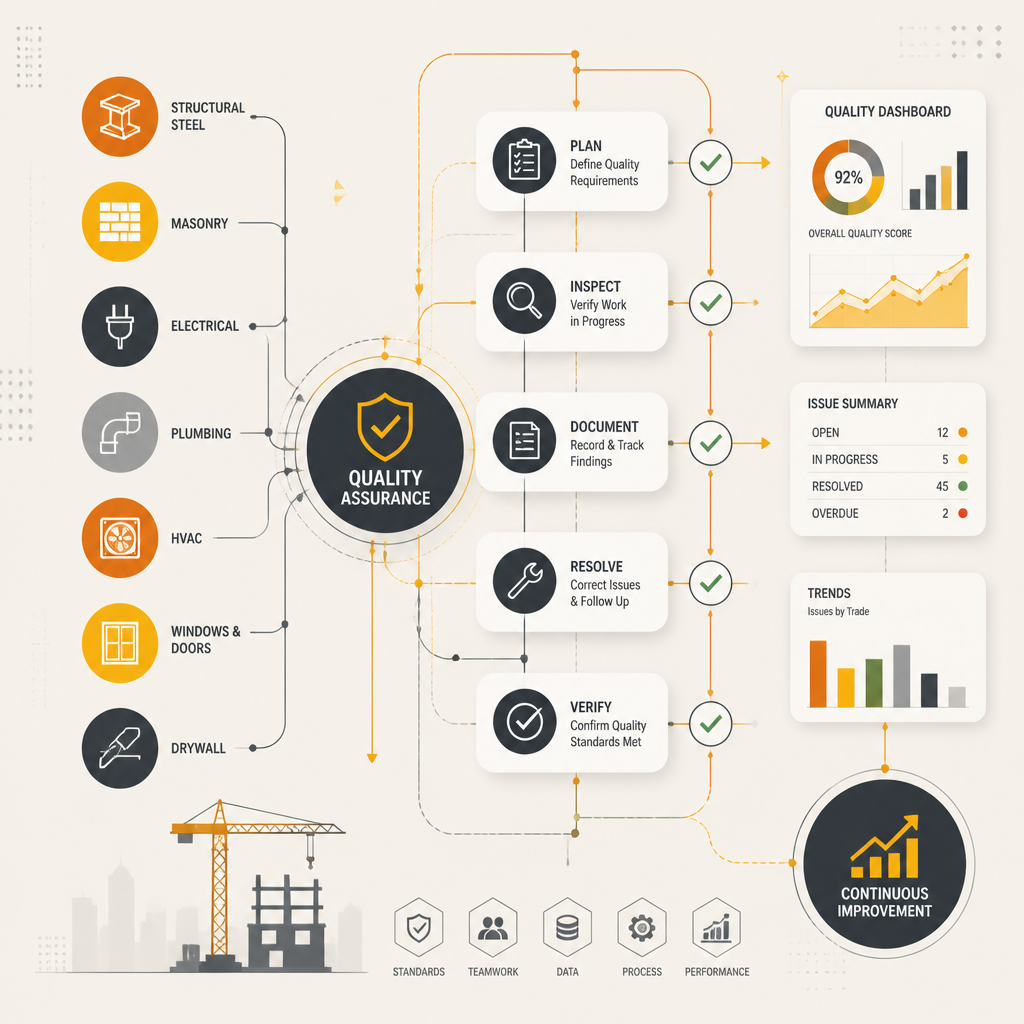
The application of defect statistics reporting differs between townhouse developments and highrise projects, and it is worth being specific about both contexts because the practical challenges are different.
Townhouse Developments in Logan, Ipswich, and Redland Bay
A townhouse development of 30 to 80 lots provides an ideal data set for trade performance reporting. Each lot is essentially the same build, using the same subcontractors, to the same specification. When the same painting crew finishes every lot in a stage, any variation in defect rates across lots is attributable to workmanship consistency, not specification differences. That consistency of build type makes the statistical comparison very clean.
For developers managing staged releases in growth corridors such as Ipswich and Redland Bay, the timing of inspections matters. A pre-handover inspection at every lot, rather than a sample inspection, is the only way to build a complete data set. Sampling introduces survivorship bias. The lots you did not inspect may be the ones with the worst defects, and if those defects surface after settlement, you have no inspection data to support a trade call-back.
Highrise Developments on the Gold Coast and Brisbane
Highrise projects present a different challenge. The building is a single structure with multiple levels, multiple wet areas, common property elements, and complex trade sequencing. Defect statistics reporting for a highrise requires a different inspection methodology, typically involving staged inspections by floor or by zone, with defect data coded by level and by trade.
The common property elements, including lobbies, corridors, car parks, and rooftop areas, need to be inspected and coded separately from individual apartments. Body corporate obligations mean that defects in common property carry specific legal weight, and the data needs to reflect that distinction clearly.
GoInspect’s customised reports for highrise developments are designed to support this structure, with defect coding that distinguishes lot-specific defects from common property defects and attributes each item to the relevant trade. That level of specificity is what allows a developer to have a targeted conversation with a waterproofing contractor about wet area performance on Levels 4 through 7 rather than a general complaint about the building.
Comparing Reporting Approaches: What Actually Moves the Needle
Not all inspection reports support trade performance analysis equally. The table below compares three distinct approaches builders and developers in Brisbane use, ranging from the most basic to the most analytically useful.
| Reporting Approach | What You Get | Suitability for Trade Performance Reporting |
|---|---|---|
| Basic written defect list (text-only, no photos, no trade attribution) | A list of issues at a single property. No visual evidence. No trade responsibility assigned. | Not suitable. Cannot aggregate across lots. Trade disputes are unresolvable without photos. No statistical value. |
| Photo-enhanced inspection report (photos per defect, trade attribution, location reference) | Individual lot defect report with full visual evidence and trade assignments. Can be aggregated manually across lots. | Suitable for small developments. Manual aggregation is time-consuming for large stages. Requires consistent category coding across inspections. |
| Aggregated defect statistics report (photo-enhanced base reports plus compiled trade performance data across multiple lots or stages) | Trade-level defect frequency tables, defect rates per lot, trend data across stages, and ranked defect categories. Directly usable for subcontractor reviews and quality assurance documentation. | Best fit for developers and volume builders. Provides the longitudinal data needed for performance management. Supports QBCC dispute documentation and quality assurance certificate compliance. |
The basic written defect list is the approach that generates the most disputes. When a builder disputes a defect claim and there is no photo, no location reference, and no trade attribution, the claim is effectively unevidenced. Every builder who has been through a QBCC complaint process will recognise that scenario. The defect statistics approach eliminates it at the source.
Quality Assurance Certificate and Practical Completion: How the Data Feeds Compliance
In Queensland, the practical completion inspection is a formal milestone. It is the point at which the builder claims the work is complete and the homeowner or developer has the opportunity to identify items that do not meet the contract specification or the QBCC Standards and Tolerances Guide. The quality assurance certificate for a builder in Queensland represents a documented commitment that the work meets those standards.
A defect statistics report that covers the practical completion stage gives a builder specific, evidenced documentation that systematic quality checks were conducted, defects were identified and assigned to trades, and rectification was completed before the certificate was issued. That documentation is valuable in three specific contexts.
First, it supports the builder’s own quality assurance process by providing a consistent record of pre-handover quality across every lot. Second, it provides an evidential base if a homeowner later disputes the condition of the property at handover. Third, it demonstrates to the QBCC, in the event of a complaint, that the builder operated a documented quality process rather than relying on a site supervisor’s walkthrough.
For developers delivering new homes in Brisbane, the Gold Coast, Logan, Ipswich, and Redland Bay, same-day reporting from the inspection service is also a practical requirement at the practical completion stage. Settlement timelines are often tight, and a defect report that takes five days to arrive is of limited use when the builder needs to schedule trade returns within 48 hours. GoInspect’s same-day reporting capability is designed specifically for this operational reality.
Frequently Asked Questions
What is the difference between a building defect statistics report and a standard pre-handover inspection report?
A standard pre-handover inspection report documents defects at a single property at a single point in time. A building defect statistics report aggregates data from multiple inspections across a development to produce a ranked breakdown of defect frequency by trade, by construction phase, and by defect category. The statistics report is a management tool for builders and developers. The single-lot report is the source data that feeds it.
How many lots or inspections do I need before a defect statistics report is useful?
In practice, meaningful patterns start to emerge from around 8 to 10 lots using the same subcontractor team. Below that threshold, individual variation in workmanship can distort the picture. For a townhouse development of 30 lots or more, the data set is large enough to identify genuine performance differences between trades with a high degree of confidence. For highrise projects, a floor-by-floor or zone-by-zone inspection approach can generate a comparable data set from a single building.
Can a defect statistics report be used in a QBCC dispute or complaint process?
Yes. A defect statistics report produced from independent inspections conducted by a fully licensed building inspector provides evidenced documentation of defects identified before handover, the trade responsible for each defect, and the frequency of defects across the project. This kind of systematic documentation strengthens a builder’s or developer’s position in a QBCC complaint process and supports the body corporate in pursuing rectification for common property defects in a strata development.
Does defect statistics reporting work for highrise developments as well as house-and-land projects?
Yes, but the inspection methodology needs to be adapted. Highrise developments require defect coding by level, by apartment or lot, and by property type (lot versus common property), in addition to trade attribution. GoInspect offers customised report formats for highrise developments that support this level of coding. The resulting data allows a developer to identify whether a defect pattern is confined to specific floors, a specific subcontractor’s work zone, or a specific construction phase such as wet area waterproofing or facade installation.
What is the role of the quality assurance certificate for a Queensland builder, and how does defect data support it?
The quality assurance certificate in Queensland represents a builder’s documented commitment that the work meets contract specifications and the QBCC Standards and Tolerances Guide. Defect statistics reporting supports this by providing a systematic, evidenced record of quality checks conducted across every lot or stage, the defects identified, the trades responsible, and confirmation that rectification was completed. This documentation demonstrates a genuine quality process rather than relying on informal site walkthroughs, which is a meaningful difference in the event of a post-settlement dispute.
How quickly should a builder expect to receive defect reports, and why does turnaround time matter for developers?
For practical completion inspections, same-day reporting is the standard that matters operationally. When a builder has a settlement scheduled within a few days of the inspection, a report that takes four or five days to arrive leaves no time to schedule trade returns and confirm rectification before the handover date. GoInspect’s same-day reporting is designed specifically for the settlement timelines that apply to new home developments in Brisbane, Gold Coast, Logan, Ipswich, and Redland Bay, where delays in the inspection report can translate directly into delayed settlements and strained client relationships.
Which trades generate the most defects in Queensland new home construction, according to industry data?
According to the QBCC Industry Snapshot published in March 2025, internal paint application is the most commonly reported defect type in Queensland, with 1,875 defect items identified across 315 complaint cases. Roof sheet metal cladding, flashings and capping, timber door and window joinery, floor tiling, and plasterboard linings also rank consistently among the top reported defect categories. Waterproofing is identified as a particularly high-cost defect category, with bathroom warranty claims averaging almost $25,000 in rectification costs per claim during the 2024 to 2025 financial year.
If you are a builder or developer in South East Queensland and you have used defect statistics reporting to manage trade performance, we would like to hear what worked and what the data actually changed in your subcontractor review process.
We would love your feedback and any insights you would share with others. What perspective would you add?
References
- Queensland Building and Construction Commission: Overview of the top 10 most common building defects reported across Queensland and why they matter for builders and homeowners
- Queensland Building and Construction Commission: Detail on internal paint application as the number one reported building defect type in Queensland, with 1,875 defects across 315 cases
- Queensland Building and Construction Commission: Why waterproofing defects remain among the most costly and disruptive issues in Queensland residential construction
- Peer-reviewed research on risk management strategies for common residential construction defects in Queensland, analysing data across multiple trades
- Practical guide to defect investigations in Brisbane, including how reports are used by property owners, builders, and developers in the rectification process