

Most developers finishing a multi-stage residential project have no real visibility into which trades are underperforming until the defect list becomes unmanageable. A defect statistics report changes that. It converts raw inspection data into patterns, showing which subcontractors are generating the most rectification work, which building phases carry the highest defect concentration, and where quality control is breaking down before problems compound across multiple lots. For developers managing projects across Brisbane, Gold Coast, Logan, Ipswich, or Redland Bay, this type of reporting is not a nice-to-have. It is the difference between managing quality and reacting to complaints.
Table of Contents
- Quick Takeaways
- What Is a Defect Statistics Report
- How It Differs from a Standard Defect Report
- How Developers Use Defect Statistics Reports
- Construction Defect Tracking in Queensland
- Comparison of Reporting Approaches
- What a High-Quality Developer Inspection Report Contains
- Common Mistakes Developers Make with Defect Data
- Frequently Asked Questions
- References
Quick Takeaways
| Key Insight | Explanation |
|---|---|
| A defect statistics report aggregates, not just lists | Unlike a single-lot defect report, it summarises defect frequency, category, and trade responsibility across multiple inspections or stages. |
| Trade attribution is the most actionable output | When defects are mapped to specific subcontractors, developers can make evidence-based contract decisions rather than relying on anecdotal complaints. |
| It supports warranty and liability management | Queensland builders operating under the QBCC framework benefit from documented defect histories when disputes arise over who bears rectification costs. |
| High-rise developments generate disproportionately complex data | Multi-storey projects with multiple trades working simultaneously need category-level defect tracking to prevent cross-trade blame shifting. |
| Same-day reporting is not optional at practical completion | Delays between inspection and reporting allow verbal disputes about what was or was not observed. Timestamped photo evidence eliminates ambiguity. |
| Defect rates by stage reveal systemic issues | If Stage 3 consistently produces more defects than Stage 1, the data points to a scheduling or supervision failure, not random variation. |
| Developers use statistics reports to protect future projects | Aggregated data from completed projects informs procurement decisions, scope-of-work language, and quality checkpoints for upcoming developments. |
What Is a Defect Statistics Report
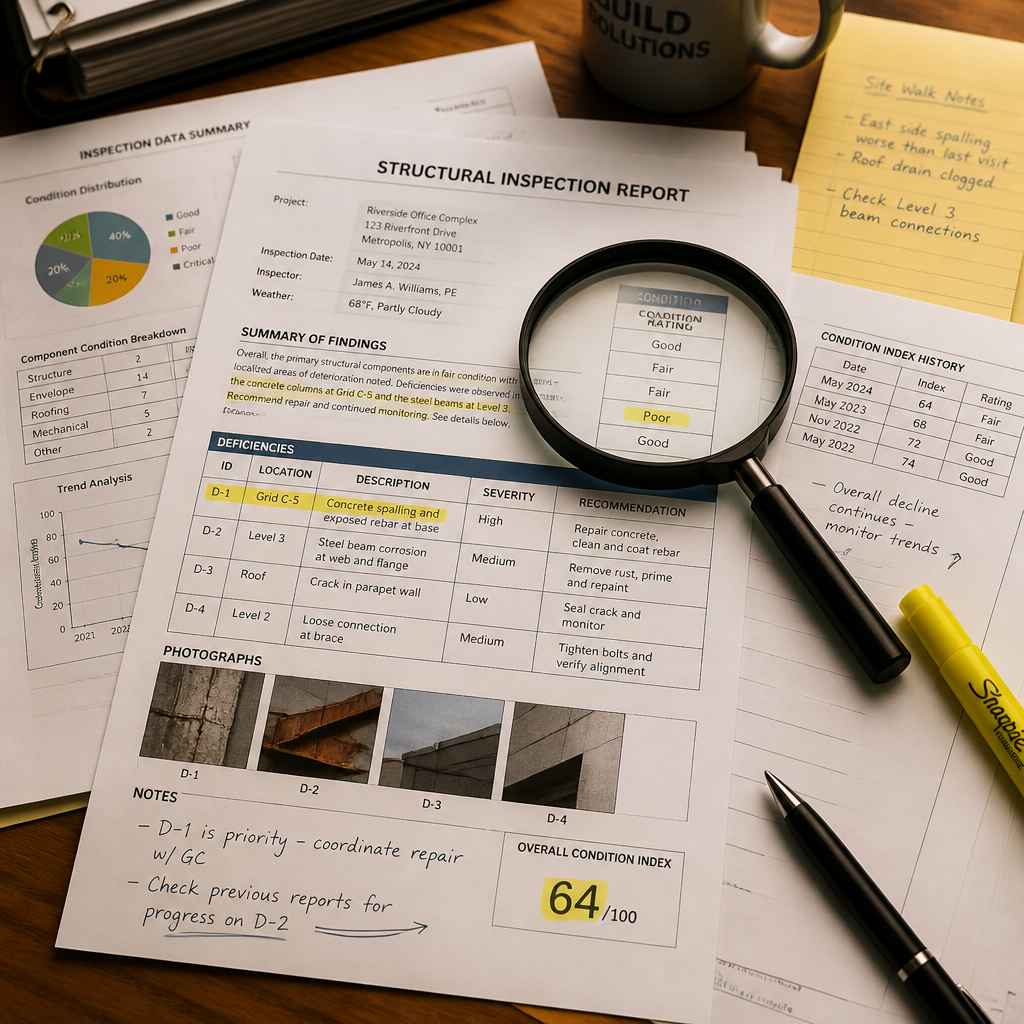
A defect statistics report is a structured analytical document that consolidates defect data from multiple property inspections into measurable trends. Rather than describing the cracked render on Lot 14 or the misaligned door frame on Lot 22 in isolation, it groups those observations by trade category, defect type, inspection stage, and frequency. The result is a quantitative picture of construction quality across an entire project or portfolio.
In practice, these reports are generated after a series of pre-handover or practical completion inspections across a housing estate or multi-stage apartment development. Each individual inspection produces a detailed defect list. The statistics report layers on top of that data, answering questions like: how many defects per lot are attributable to the tiling trade, and is that number increasing or decreasing as the project progresses?
The data consistently shows that construction defects are not randomly distributed. According to the Queensland Building and Construction Commission, the most common categories of complaints involve incomplete work, water penetration, and structural issues. A properly structured defect statistics report will surface exactly these patterns before they escalate into formal complaints or QBCC disputes.

The Core Components of the Report
A well-constructed defect statistics report will include a defect count by trade, a defect count by category (structural, waterproofing, finishing, mechanical), a per-lot or per-unit defect rate, a rectification completion rate across inspection cycles, and a trend comparison between project stages. Without all of these components, the report is just a summary, not a statistics report in any useful sense.
Pro tip: When commissioning a developer inspection report for a staged housing project, request that the inspector use consistent defect category codes across all lots from the first inspection. Retroactively standardising categories across 80 lots is expensive and time-consuming, and most of that cost falls on the developer.
How It Differs from a Standard Defect Report
A standard defect report, such as the kind a homebuyer receives at practical completion, documents observed defects for a single property at a single point in time. It is a snapshot. A defect statistics report is a longitudinal dataset. The distinction matters enormously for developers who are managing 50 to 300 lots simultaneously across South East Queensland.
The standard report answers: what is wrong with this property? The statistics report answers: what is systemically wrong with this project, and which party is responsible? These are fundamentally different questions with fundamentally different business implications.
A common mistake is assuming that a folder of individual defect reports serves the same function as a properly aggregated statistics report. It does not. Manually reviewing 80 PDFs to identify trade patterns is neither efficient nor accurate. The statistics report performs that synthesis automatically, provided the underlying inspection data is categorised consistently from the start.
How Developers Use Defect Statistics Reports
Developers across Brisbane and the Gold Coast use defect statistics reports for at least four distinct operational purposes. Each serves a different decision-making function, and conflating them leads to underuse of the data.
Subcontractor Performance Management
The most direct use is trade accountability. When a developer’s defect statistics report shows that the plastering contractor is responsible for 34% of all defects across the project, that contractor has a documented performance problem, not just bad luck on a few lots. That data supports contract renegotiations, withholding retention payments, or termination with cause.
Without statistical aggregation, these conversations become disputes of opinion. With it, they become structured performance reviews backed by timestamped photo evidence and numeric defect counts. Developers who have managed projects through QBCC adjudication consistently report that documented defect data is their strongest asset in those proceedings.
Stage-by-Stage Quality Benchmarking
Developers delivering multi-stage projects use defect statistics reports to compare quality outcomes between stages. If Stage 1 averaged 12 defects per lot at practical completion and Stage 3 is averaging 22, that is not acceptable variation. It is a trend requiring immediate supervisory intervention before Stage 4 commences.
This kind of benchmarking is only possible when inspections are conducted consistently across every stage using the same construction defect tracking categories and reporting standards. Inconsistent inspection quality produces misleading comparisons.
Handover Readiness and Settlement Risk Management
Settlement is time-sensitive. In Queensland’s residential market, delays caused by unresolved defects at handover create real financial exposure for developers, including penalty interest, purchaser rescission rights under the contract, and reputational damage in a market where referrals drive repeat sales.
A defect statistics report identifies lots approaching handover with above-average defect counts, allowing the development manager to prioritise rectification resources before settlement dates. This is reactive management done efficiently, rather than crisis management done expensively.
Procurement and Contract Language for Future Projects
The most underused application of defect statistics reports is feeding their findings into the next project. Developers who systematically retain their defect data across multiple projects build an evidence base for writing tighter subcontractor scopes, setting realistic quality KPIs, and identifying which trades consistently require closer supervision in Queensland’s construction environment.
Construction Defect Tracking in Queensland
Queensland has a specific regulatory context that makes construction defect tracking more consequential than in most other Australian states. The Queensland Building and Construction Commission Act 1991 establishes statutory warranty obligations for builders, including a 12-month defect liability period for non-structural defects and a six-year period for structural defects. Developers who cannot demonstrate documented defect management during these periods face liability exposure that could otherwise have been managed with proper records.
The QBCC also operates a complaint and dispute resolution framework that is increasingly data-intensive. Inspectors and adjudicators expect documentary evidence, not verbal accounts. A defect statistics report produced by a licensed inspector, supported by timestamped photographs and categorised defect lists, carries significantly more weight than an informal punch list compiled by a site supervisor.
“Proper documentation of defects, including dates, descriptions, and photographic evidence, is one of the most important steps a homeowner or developer can take to protect their rights under Queensland’s building warranty framework.” Queensland Building and Construction Commission guidance on building disputes.
GoInspect’s same-day reporting model is directly relevant here. When a practical completion inspection is conducted on a Wednesday morning and the report is delivered Wednesday evening with photo-linked defect categories, there is no gap in which verbal disputes can emerge about what was or was not observed. That evidentiary discipline is what makes a developer inspection report usable in a formal dispute context.
Pro tip: Request that your inspection provider assign each defect a unique identifier tied to the lot number and trade category. This makes it straightforward to cross-reference rectification completion against the original defect list during follow-up inspections, which is exactly the kind of audit trail the QBCC expects in a formal dispute.
Comparison of Reporting Approaches
Not all developer inspection reporting is structured the same way. The approach a developer selects has direct consequences for how useful the data is in practice.
| Reporting Approach | What It Provides | Practical Limitation |
|---|---|---|
| Individual lot defect reports only | Detailed defect records per property, useful for handover documentation and homebuyer communication | No aggregation across lots, so trade performance patterns and stage-level quality trends remain invisible without manual analysis |
| Defect statistics report with trade attribution | Aggregated defect counts by trade, category, and stage, enabling performance management and procurement decisions | Requires consistent defect categorisation from inspection one, and is only as reliable as the underlying individual inspection quality |
| Customised developer inspection report for high-rise | Apartment-by-apartment defect tracking with common area and building envelope categories, plus trade attribution across floor plates | More complex to administer and requires inspectors with specific experience in multi-storey construction defect identification |
What a High-Quality Developer Inspection Report Contains
A developer inspection report that supports genuine defect statistics analysis has specific characteristics that distinguish it from a basic pre-handover checklist. Developers should evaluate their inspection provider against these criteria before committing to a multi-stage project engagement.
Photo-Linked Defects with Trade Attribution
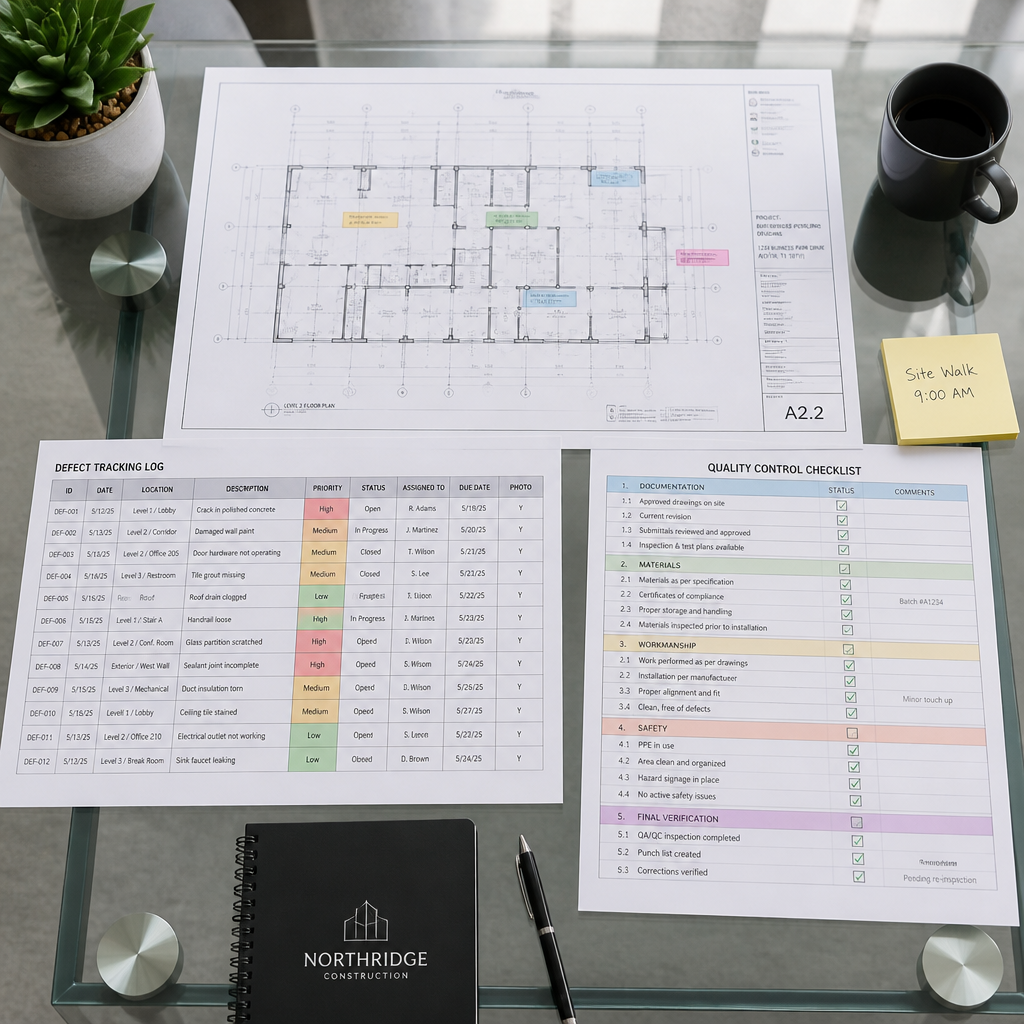
Every defect entry should include at least one photograph, a description of the defect, the location within the property, and the responsible trade. Reports that list defects without trade attribution are not useful for the subcontractor performance management functions described above. They become a to-do list, not an accountability tool.
Consistent Defect Category Taxonomy
The categories used to classify defects must remain identical across every lot and every stage. Common high-level categories include structural, waterproofing and drainage, external finishes, internal finishes, joinery and fixtures, mechanical and electrical, and site works. If these categories shift between inspection rounds, the statistics become incomparable, which eliminates the value of the report entirely.
Rectification Tracking Across Inspection Cycles
A defect statistics report gains its full value when it tracks not just defect identification but defect closure. Knowing that a plastering contractor generated 45 defects across 30 lots is useful. Knowing that 38 of those defects were closed within 14 days and 7 required escalation tells you whether that contractor’s rectification process is functioning or not. GoInspect’s reporting structure supports this kind of multi-cycle tracking for developers managing ongoing projects across South East Queensland.
Common Mistakes Developers Make with Defect Data
Collecting defect data and using it effectively are two different skills. Developers who invest in inspection services but then underuse the resulting data leave significant value unrealised.
The most common mistake is treating the defect report as a handover formality rather than a management input. Reports are filed, trades are notified, rectification happens or does not happen, and the data is never reviewed at a project level. The statistics that would have informed Stage 4 procurement decisions sit unused in a shared drive.
A second common mistake is engaging different inspection providers across different stages of the same project. When Category A defects in Stage 1 are defined differently by Provider X than by Provider Y in Stage 3, the comparative data is worthless. Consistency of inspector and methodology across the full project life cycle is not a minor administrative preference. It is a prerequisite for meaningful defect statistics.
A third mistake is waiting until practical completion to begin defect tracking. Developers who commission inspections at frame stage, pre-plaster, and pre-paint, in addition to practical completion, accumulate a defect history that shows when in the construction timeline problems are introduced. This upstream tracking reduces the volume of defects reaching practical completion and reduces the cost of rectification, because defects found earlier in the build are almost always cheaper to fix than those found after finishes are complete.
Frequently Asked Questions
What is the difference between a defect statistics report and a defect liability schedule?
A defect liability schedule is a contractual document that lists outstanding defects requiring rectification under a builder’s warranty obligation. A defect statistics report is an analytical document that aggregates inspection data across multiple properties or stages to reveal patterns, trade performance, and quality trends. The schedule tells you what needs fixing on a specific property. The statistics report tells you why defects are occurring at a project level and which parties are responsible.
How many lots does a developer need before a defect statistics report becomes meaningful?
In practice, statistically meaningful patterns begin to emerge at around 10 to 15 lots inspected with consistent defect categories. Below that threshold, individual variation can distort trade-level conclusions. For high-rise developments, floor plate comparisons become meaningful after three or four floors are inspected, provided the inspection methodology is identical across all floors.
Can a defect statistics report be used as evidence in a QBCC dispute?
Yes, provided it is produced by a licensed inspector and the underlying data is documented with timestamps, photographs, and clear defect descriptions. The QBCC’s dispute resolution process places significant weight on documentary evidence. A defect statistics report that demonstrates a pattern of repeated defects by a specific trade, supported by photo-linked individual inspection reports, is substantially more persuasive than verbal accounts or informal site notes.
How often should developers commission defect statistics reports during a project?
For staged housing estates in Queensland, a statistics review at the completion of each stage is the minimum. For projects with six or more months between stages, a mid-project review is advisable. For high-rise developments, a floor-by-floor statistics review after every three to five floors allows supervisory adjustments before construction progresses further, which is where the cost savings from early defect identification are largest.
Does GoInspect provide defect statistics reports for high-rise developments?
Yes. GoInspect offers customised reporting for high-rise and multi-stage developments, including trade attribution, category-level defect aggregation, and same-day photo-enhanced reports. This structured approach allows developers to track defect patterns across floor plates and building envelopes with the same rigour applied to individual lot inspections. Developers and builders working across Brisbane, Gold Coast, Logan, Ipswich, and Redland Bay can contact GoInspect directly at goinspect.com.au to discuss project-specific reporting requirements.
What trades generate the most defects in Queensland residential construction?
Based on consistent inspection data across South East Queensland residential projects, the trades generating the highest defect volumes at practical completion are waterproofing and tiling, plastering and rendering, painting, and joinery installation. Waterproofing defects are particularly consequential because they often become structural over time and fall within Queensland’s six-year statutory warranty period. Catching these at practical completion, rather than post-settlement, is where early defect tracking delivers the clearest financial benefit for developers.
If you have used a defect statistics report on a Queensland development project, share what worked or what you would do differently in your next project.
References
- Queensland Building and Construction Commission official guidance on builder warranty obligations and dispute resolution processes
- Statista global data platform covering construction industry defect rates, project completion statistics, and subcontractor performance benchmarks
- McKinsey and Company research on construction productivity, quality management, and the cost of defect rectification in residential development
- Forbes coverage of construction industry quality control, developer risk management, and property market trends in Australia
- Australian Institute of Quantity Surveyors resources on construction cost management, defect liability, and project quality benchmarking