
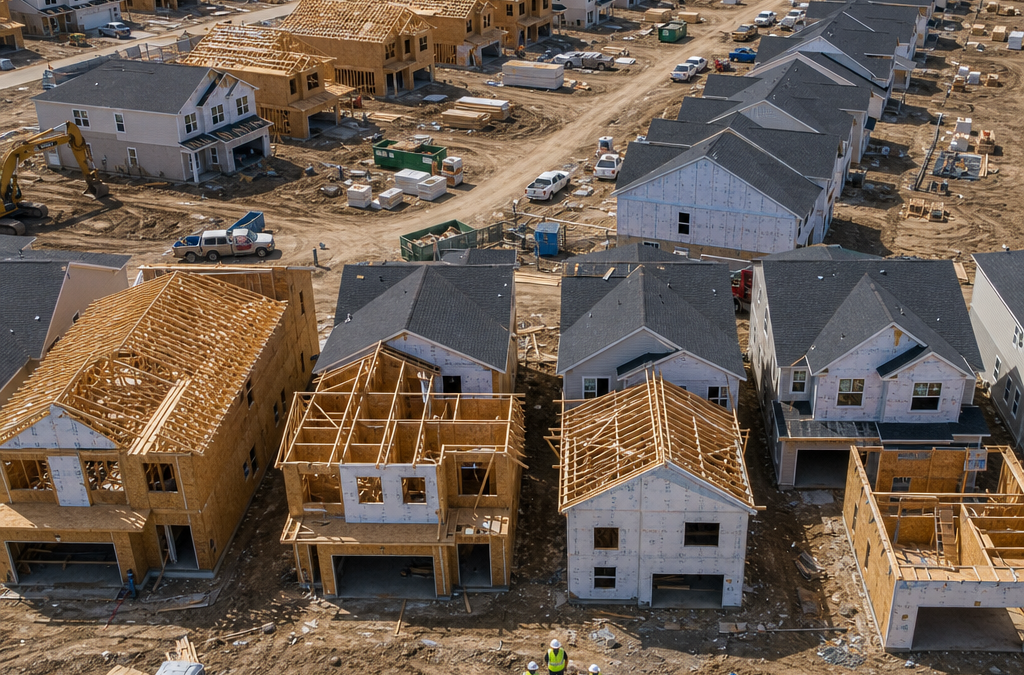
When a housing development spans 50, 100, or 500 lots, a single defect missed at handover is an inconvenience. A pattern of defects missed across every unit is a liability. Yet most builders still rely on standalone inspection reports that treat each dwelling in isolation, with no mechanism to surface recurring failures across the broader project. A defect statistics report changes that entirely. It aggregates individual inspection data into project-wide patterns, exposes which trades are consistently underperforming, and gives developers, site managers, and quality assurance teams the hard numbers they need to act before defects become disputes.
Table of Contents
- Quick Takeaways
- What Is a Defect Statistics Report?
- Why Individual Reports Fall Short on Large Developments
- How Defect Statistics Drive Builder Quality Assurance
- The Data Behind Common Defect Categories
- Comparison of Reporting Approaches for Housing Developments
- Using Defect Statistics in High-Rise and Master-Planned Communities
- How GoInspect Builds Statistics Reporting into Every Project
- Frequently Asked Questions
- References
Quick Takeaways
| Key Insight | Explanation |
|---|---|
| Defect statistics reports reveal trade-level failure patterns | By aggregating defects across all lots, builders can identify whether, for example, a specific tiling subcontractor is responsible for 70% of waterproofing failures on a project. |
| Same-day reporting is non-negotiable at scale | On a 100-lot development, delayed reporting creates scheduling chaos. Statistics are only actionable when the data is current and accessible immediately after each inspection. |
| Photo-enhanced defect records are the evidence layer | Raw numbers without photographs are disputable. Photo evidence linked to each defect entry makes trade accountability impossible to argue against. |
| Statistics reports reduce rectification costs over time | When a recurring defect is caught after five lots rather than fifty, the remediation scope shrinks dramatically and the cost per defect falls. |
| Housing development inspections must cover structural and cosmetic defect categories separately | Combining them distorts the statistics. Structural defects carry different risk and cost profiles and must be tracked independently in any meaningful analysis. |
| Defect data supports contract and warranty enforcement | Statistical evidence of a trade’s defect rate across a project strengthens a developer’s legal position in warranty claims and QBCC disputes. |
| Builder quality assurance programs without data are guesswork | Anecdotal quality checks do not scale. A statistics-backed inspection program replaces guesswork with measurable benchmarks that can be tracked across project stages. |
What Is a Defect Statistics Report?
A defect statistics report is a structured data summary generated from multiple individual housing development inspections conducted across a single project. Rather than presenting one home’s defects in isolation, it compiles defect counts, categories, trade assignments, and rectification statuses across every inspected lot and produces comparative metrics that a project manager can actually use.
In practice, these reports answer questions that standalone inspection reports cannot. Which trade has the highest defect rate? Which lot stage is generating the most failures? Are the same defects appearing in stage three that appeared in stage one, suggesting a systemic problem rather than a one-off error? Without aggregated data, those questions go unanswered until the defects become disputes.
At GoInspect, the defect statistics report is built into the inspection workflow for large housing developments across Brisbane, Gold Coast, Logan, Ipswich, and Redland Bay. Every photo-enhanced defect recorded during a new home inspection feeds into a project-wide dataset, making the statistics report a live document rather than a retrospective summary produced months after handover.

Why Individual Reports Fall Short on Large Developments
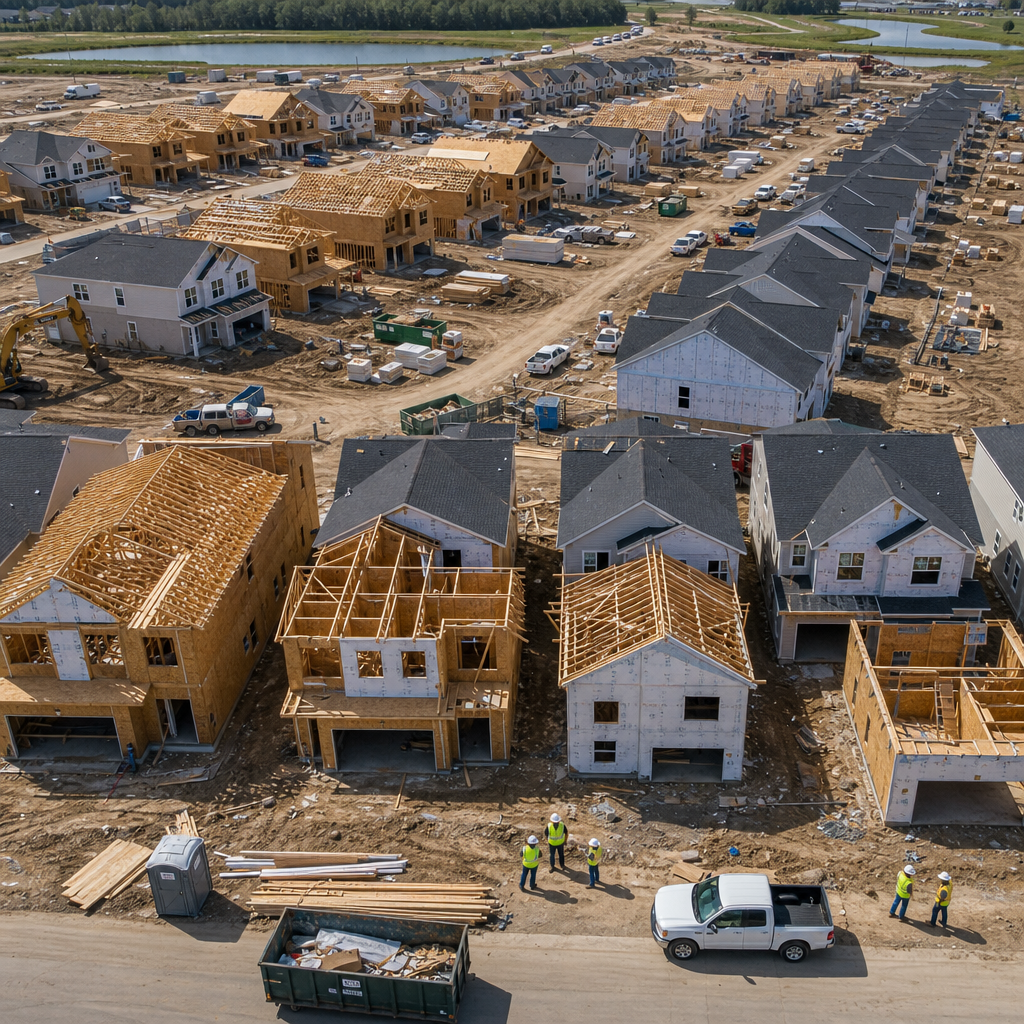
A single pre-handover inspection report for one dwelling tells the homeowner or investor everything they need to know about that specific property. It identifies defects, assigns responsibility, and creates a rectification list. That is exactly what it should do. But for a developer managing 80 townhouses or a builder overseeing a 200-lot estate, one report is forensic evidence for one address, not a management tool for the entire project.
The isolation problem in multi-lot inspections
The data consistently shows that defects in large residential developments are rarely random. Waterproofing failures cluster by subcontractor. Render cracks concentrate in specific stages where a concrete batch or mix ratio varied. Electrical non-compliances repeat because one licensed electrician on the roster has a consistent practice gap. Without a defect statistics report aggregating these findings, site managers rely on memory and gut instinct to spot trends that the data would make obvious.
A common mistake is assuming that a builder’s own internal quality checks will catch these patterns. Internal checklists are often completed by the same crews whose work is being assessed, creating an obvious conflict. An independent housing development inspection program with statistics reporting removes that conflict and produces data that is defensible in front of a developer, a QBCC auditor, or a court.
Escalating costs when trends are caught late
The Queensland Building and Construction Commission (QBCC) receives thousands of complaint lodgements every year, and a significant proportion relate to defects that were present at practical completion but not formally documented. The financial exposure for developers who cannot demonstrate a systematic inspection process is substantial. Catching a recurring defect after five lots instead of fifty is not just operationally convenient. It is the difference between a targeted rectification program and a project-wide remediation crisis.
Pro tip: Schedule your first defect statistics review after inspecting no more than 10% of total lots on a large development. Early trend data at that stage gives site management enough time to intervene with specific trades before the pattern becomes embedded across the whole project.
How Defect Statistics Drive Builder Quality Assurance
Builder quality assurance is only as good as the information feeding it. A quality assurance process built on checklists without data tells a builder that inspections occurred. A process built on defect statistics tells a builder where the failures are, how often they occur, which trades are responsible, and whether interventions are working. Those are very different outcomes.
Trade accountability as a quality lever
When a defect statistics report shows that a single plastering subcontractor accounts for 65% of all surface finish defects across a 60-lot project, the conversation with that subcontractor changes immediately. Anecdotal feedback is deniable. A table showing defect counts, lot numbers, inspection dates, and photo references is not. Builders who implement statistics-backed inspection programs consistently report faster rectification turnaround from subcontractors because the evidence removes ambiguity about responsibility.
GoInspect’s inspection reports are designed specifically to assign each defect to a responsible trade, which means that when those individual reports are aggregated into a project statistics summary, the trade-level accountability is already baked into the data structure. That is a deliberate design choice, not an afterthought.
Stage-by-stage benchmarking
Large housing developments rarely maintain consistent quality across every stage. Material supply changes, subcontractor rosters shift, and site supervision intensity varies as a project progresses. A defect statistics report that tracks defect rates by project stage gives builders a benchmark to measure whether quality is improving, holding steady, or declining as the development matures. Without that benchmark, the only quality signal a builder gets is the volume of homeowner complaints at handover, which is far too late to be useful.
“The cost of poor quality in construction is not just the rework. It is the downstream cost of disputes, delays, and reputation damage that follows when defect patterns go undetected until the damage is widespread.” McKinsey Global Institute, Reinventing Construction: A Route to Higher Productivity
The Data Behind Common Defect Categories
Understanding which defect categories appear most frequently in large housing developments is essential for interpreting a defect statistics report correctly. Not all defect types carry equal weight, and a statistics report that treats a cosmetic paint touch-up the same as a structural waterproofing failure will produce misleading prioritisation signals.
In practice, the most common defect categories observed across housing development inspections in South East Queensland fall into several consistent groupings: waterproofing and wet area failures, surface finish defects (render, paint, plasterboard), joinery and door alignment issues, external concrete and pathway cracking, and roof and drainage non-compliances. Of these, waterproofing defects carry the highest risk profile and the most significant downstream cost if unaddressed.

According to the Australian Institute of Building Surveyors, waterproofing failures account for a disproportionate share of construction defect claims relative to their initial detection frequency. This means they are systematically underdetected at handover, making them exactly the type of defect that a statistics report, combined with rigorous photo-enhanced inspection records, is designed to surface before legal exposure materialises.
Pro tip: When reviewing a defect statistics report for a housing development, sort defect categories by both frequency and estimated rectification cost separately. The most common defects are rarely the most expensive. Managing the two lists independently produces a more rational prioritisation sequence for your rectification program.
Comparison of Reporting Approaches for Housing Developments
Not all inspection reporting approaches are equal when applied to large developments. The table below compares three distinct reporting models used in the South East Queensland residential construction market.
| Reporting Approach | Strengths for Large Developments | Limitations |
|---|---|---|
| Standalone per-lot inspection reports only | Detailed defect documentation for individual homeowners. Useful for pre-handover and pre-settlement inspections at the unit level. | No aggregation across lots. Cannot identify trade-level patterns. Requires manual analysis by site managers to extract project-wide trends. Not scalable beyond 10-15 lots. |
| Defect statistics reports with photo-enhanced per-lot data | Aggregates defect counts by trade, stage, and category. Provides project-wide trends with photographic evidence at the individual defect level. Supports QBCC and warranty documentation. Same-day reporting keeps data current for active site management. | Requires a consistent inspection framework across all lots to produce comparable data. Only as accurate as the underlying per-lot inspection quality. |
| Builder-conducted internal checklists with summary reporting | Low cost. Completed on-site without scheduling external inspectors. Familiar format for site supervisors. | Conflict of interest when trades assess their own work. Checklists rarely capture photographic evidence. Summary data lacks the defect-level detail needed for trade accountability or legal defence. Widely regarded as insufficient for QBCC complaint defence. |
Using Defect Statistics in High-Rise and Master-Planned Communities
The application of defect statistics reports in high-rise developments and large master-planned communities requires a more granular data structure than a typical residential estate. In a high-rise, defects must be tracked not only by trade and category but also by floor level, building face orientation, and apartment type, since construction methods and subcontractor allocations often vary systematically by these factors.
GoInspect offers customised high-rise inspection programs that structure defect data specifically to support statistics reporting across these variables. A developer managing a 15-level residential tower with 120 apartments needs to know whether, for example, all facade cracking defects are concentrated on the north-facing units, because that immediately points to differential thermal movement as the root cause rather than random workmanship variation.
Master-planned communities and stage-release dynamics
Master-planned communities released in stages over three to five years present a particular challenge for defect statistics reporting. Each stage may use different subcontractors, different material suppliers, and different site supervisors. A statistics report that tracks defect rates consistently across all stages over the life of the project becomes an invaluable asset for the developer’s quality governance program and a powerful demonstration of due diligence to prospective buyers in later stages.
The data consistently shows that developers who implement project-wide statistics reporting from stage one, rather than retrofitting the process after problems emerge, achieve lower overall defect rectification costs and faster handover settlement rates. Starting the statistics framework early means the data has enough lot volume to produce statistically meaningful trade comparisons before defects have had time to propagate across the entire estate.
How GoInspect Builds Statistics Reporting into Every Project
GoInspect’s inspection model is built on the premise that a pre-handover inspection or practical completion inspection should produce data that is useful beyond the individual lot. Every defect identified is photographed, categorised, and assigned to a responsible trade in the report. For large housing developments, these individual records are structured to feed directly into a project-wide defect statistics summary.
Same-day reporting is central to how GoInspect operates. On an active construction site, a defect report that arrives three days after the inspection is nearly useless for site scheduling. By delivering completed reports on the day of inspection, GoInspect ensures that developers and site managers are working with current data, not historical snapshots. For a builder managing concurrent handovers across multiple lots, that timeliness is the difference between managing defects proactively and reacting to them after settlement.
The pricing model, starting from $550 including GST, is structured to make systematic inspection across all lots financially viable for developers, not just for individual homeowners. A defect statistics report that covers 50 lots at that rate delivers a project management asset worth many multiples of its cost in reduced rectification spend and dispute avoidance. Builders and developers working across Brisbane, Gold Coast, Logan, Ipswich, and Redland Bay can access GoInspect’s project-specific inspection programs with reporting tailored to their development structure.
Frequently Asked Questions
What is included in a defect statistics report for a housing development?
A defect statistics report for a housing development typically includes total defect counts per lot, defect frequency by category (structural, waterproofing, cosmetic, etc.), defect counts assigned to each responsible trade, rectification status tracking, and trend comparisons across project stages. Photo references from the underlying per-lot inspection reports are linked to provide evidence for each data point in the summary.
How does a defect statistics report support builder quality assurance?
Builder quality assurance programs need measurable benchmarks to function. A defect statistics report provides those benchmarks by quantifying defect rates per trade, per stage, and per category across the whole project. When a subcontractor’s defect rate is visible in a statistics summary, quality conversations become data-driven rather than subjective. Builders can set performance thresholds and use the statistics report to enforce them contractually.
At what project size does a defect statistics report become necessary?
In practice, defect statistics reporting adds meaningful value from about 10 lots upward. Below that threshold, a site manager can track patterns manually with reasonable accuracy. Above 10 lots, the volume of individual inspection data makes manual pattern detection unreliable. For developments of 50 lots or more, a structured statistics report is not optional if the developer intends to manage trade accountability and rectification costs systematically.
Can defect statistics reports be used as evidence in QBCC disputes?
Yes, and they are increasingly being used for exactly that purpose. A defect statistics report that shows a pattern of repeated failures by a specific trade, backed by dated photo-enhanced individual inspection reports, constitutes strong documentary evidence in a QBCC complaint or warranty dispute. It demonstrates that the defects are systemic rather than isolated, which is material to how the commission assesses liability and required remediation scope.
How does GoInspect structure defect statistics for high-rise developments versus land estates?
For high-rise developments, GoInspect structures defect data by floor level, apartment type, and building orientation in addition to trade and category. This granularity allows developers to identify defects that are specific to construction sequences or material exposures rather than treating the entire building as a single data pool. For land estates, the primary variables are lot number, project stage, and trade assignment. Both formats are designed for same-day delivery and are customised to the specific reporting needs of the development.
Is it worth commissioning defect statistics reporting if the builder has an internal quality program?
Yes. An internal quality program managed by the builder or head contractor has an inherent conflict of interest when it comes to documenting subcontractor defects. An independent statistics report produced by a licensed third-party inspector carries evidential weight that internal checklists do not. The two programs serve different purposes and should coexist on any serious housing development project.
If you are managing a housing development in South East Queensland and have experience with defect statistics reporting, we would genuinely like to hear how your approach has evolved, and what data has proven most useful for managing trade accountability across your projects.
References
- McKinsey Global Institute research on construction productivity and quality costs in large-scale residential projects
- Statista data on construction defect rates and rectification costs in the residential building sector
- Queensland Building and Construction Commission official guidance on defect complaints, warranty obligations, and builder accountability
- Australian Institute of Building Surveyors resources on building inspection standards and defect documentation practices
- Australian Building Codes Board standards relevant to construction compliance and defect classification in residential developments